Grafana Fleet Management Dashboard Documentation
Overview
This documentation covers the setup and usage of Grafana for fleet management and device monitoring. The system integrates with Omnivoltaic authentication and provides comprehensive dashboards for tracking device data, firmware versions, and fleet operations.
Authentication & Login
Grafana Login Interface
The Grafana login interface provides two authentication methods:
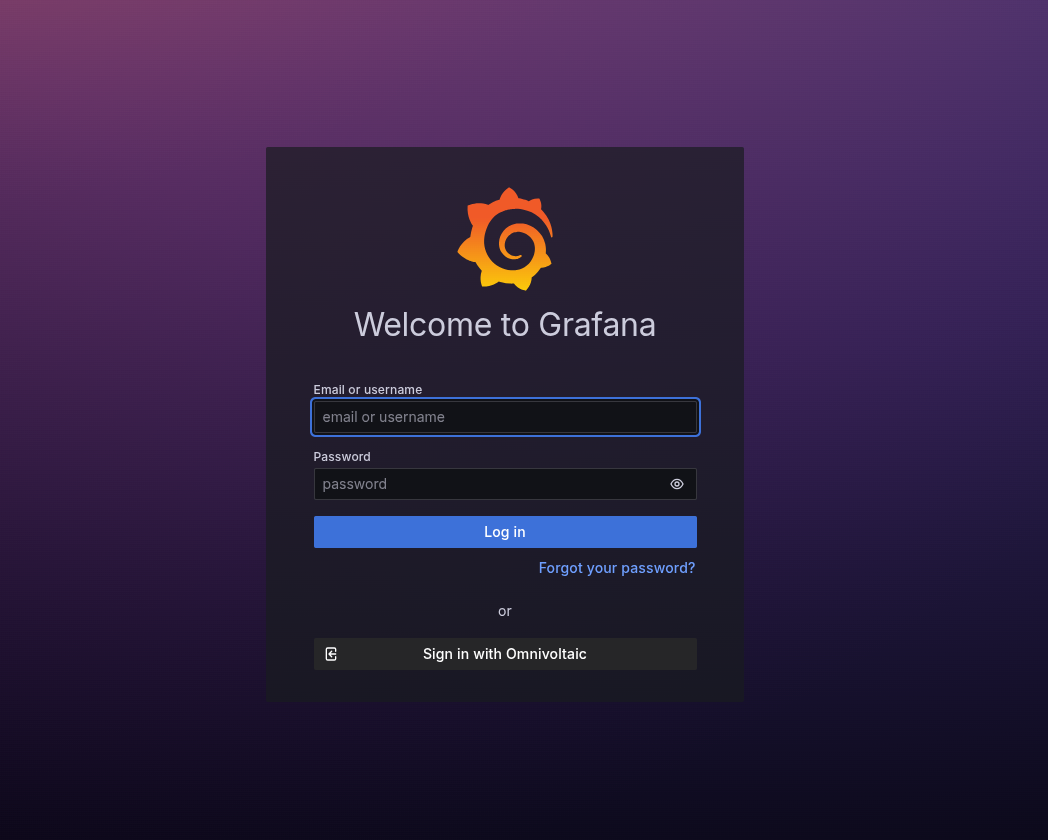
Standard Login:
- Email or Username: Enter your registered email address or username
- Password: Enter your secure password
- Forgot Password: Click the "Forgot your password?" link if you need to reset your credentials
Single Sign-On (SSO):
- Omnivoltaic Integration: Click "Sign in with Omnivoltaic" for seamless authentication
- This option redirects to the Omnivoltaic authentication system
Omnivoltaic Authentication
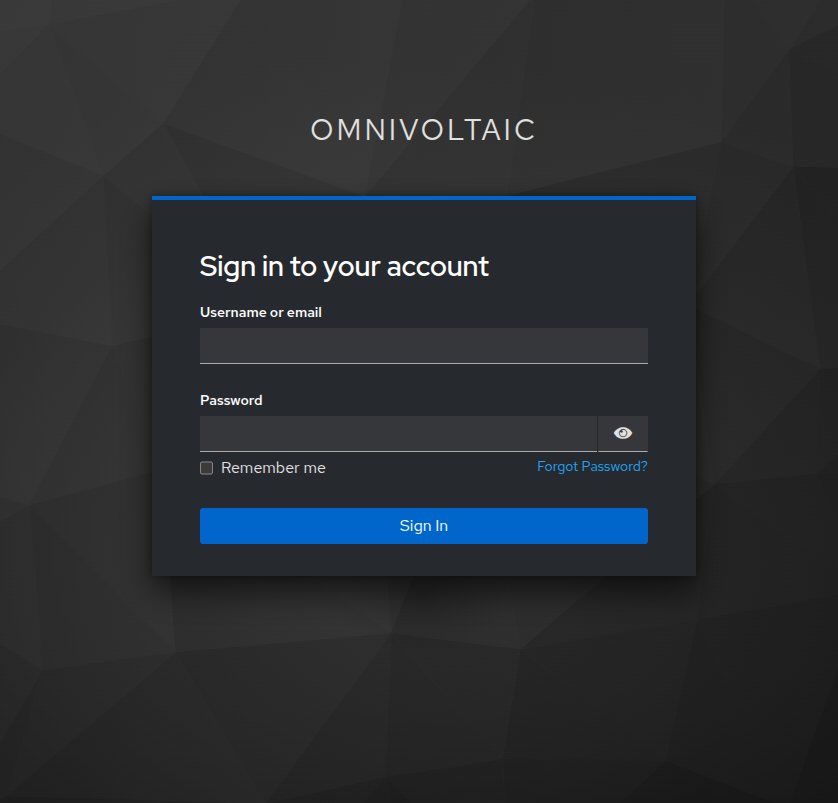
When using SSO, you'll be redirected to the Omnivoltaic authentication portal:
Login Fields:
- Username or Email: Your Omnivoltaic account credentials
- Password: Your Omnivoltaic password
- Remember Me: Check this option to stay logged in across sessions
- Forgot Password: Access password recovery options
Security Features:
- Secure token-based authentication
- Session management
Dashboard Navigation
Main Dashboard Interface
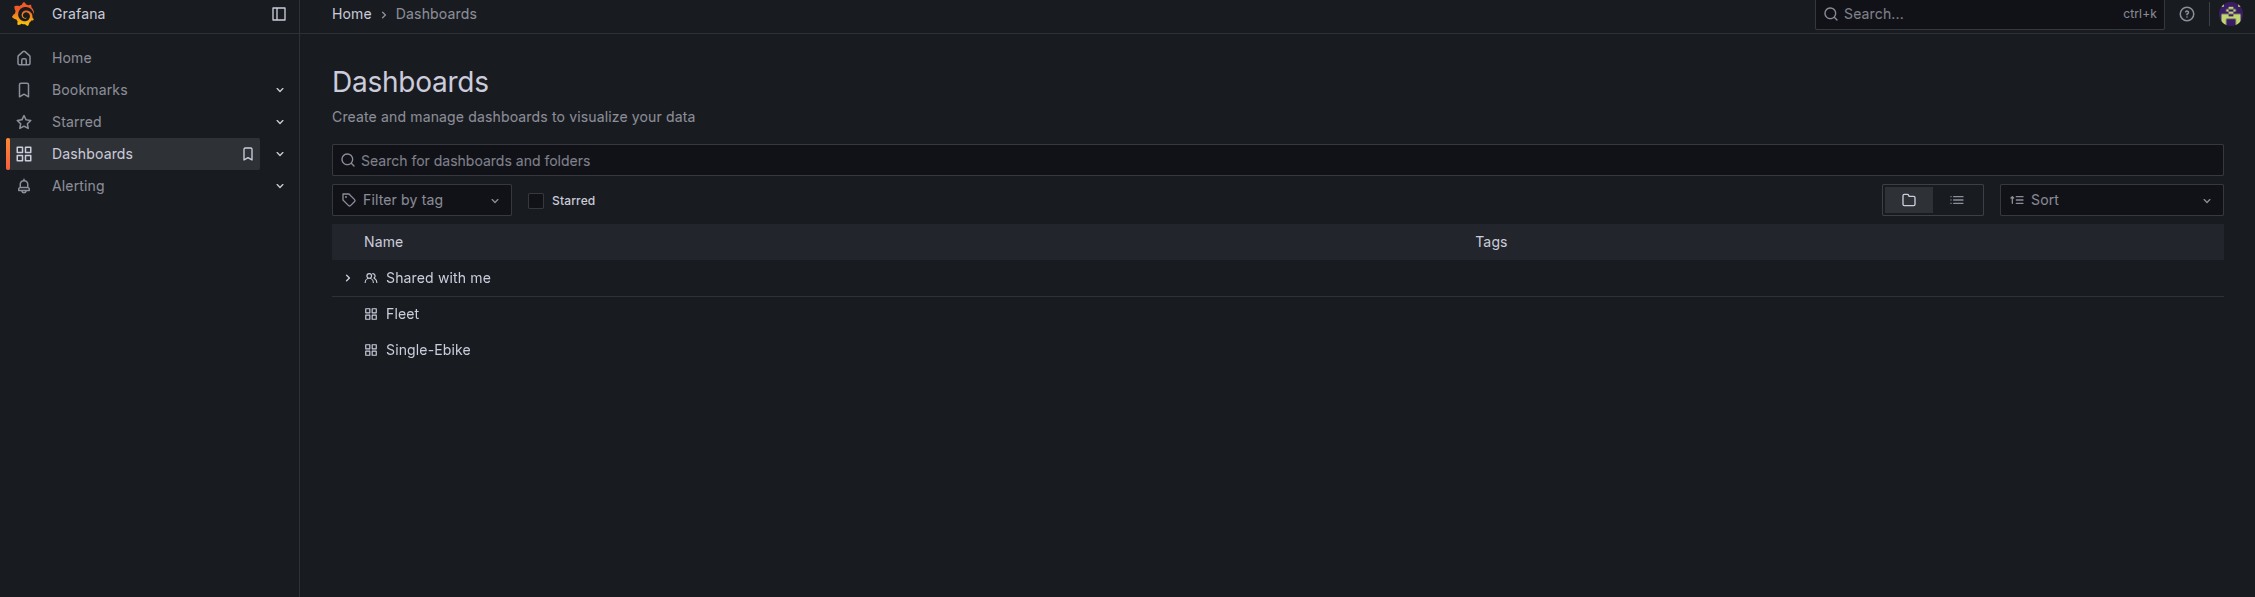
The main dashboard interface provides centralized access to all monitoring tools:
Navigation Panel (Left Sidebar):
- Home: Return to the main dashboard
- Bookmarks: Quick access to frequently used dashboards
- Starred: Your favorite dashboards for easy access
- Dashboards: Complete list of available dashboards
- Alerting: Monitor and manage system alerts
Dashboard Management:
- Search Functionality: Use the search bar to find specific dashboards
- Filter Options: Filter dashboards by tags or categories
- Sort Options: Organize dashboards by name, date, or relevance
Available Dashboards:
- Shared with me: Dashboards shared by team members
- Fleet: Main fleet management dashboard
- Single-Ebike: Individual vehicle monitoring dashboard
Fleet Management Dashboard
Single E-bike Monitoring
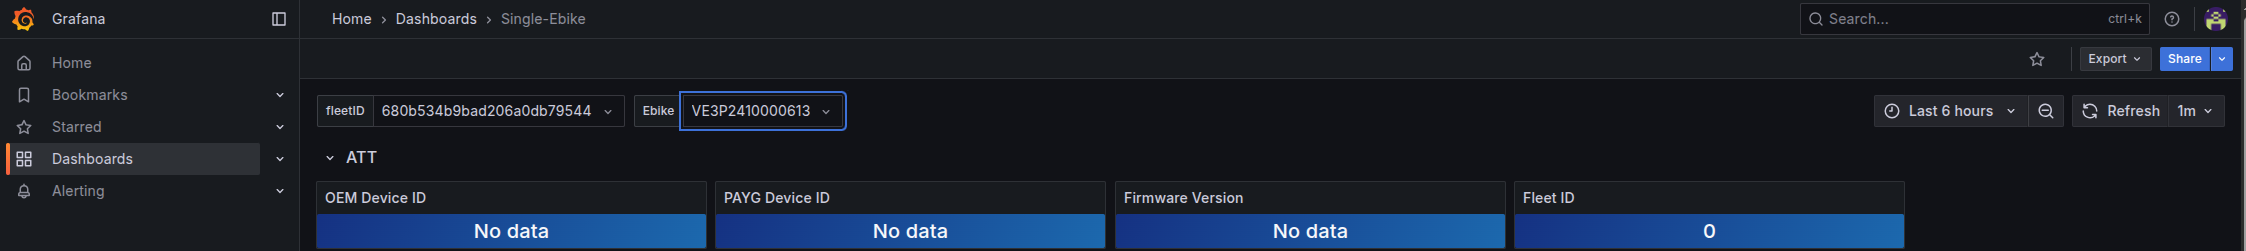
The Single E-bike dashboard provides detailed monitoring for individual vehicles in your fleet:
Dashboard Controls:
- Fleet ID: Dropdown selector showing
680b534bdba206a0db79544 - Ebike Selector: Choose specific vehicle
VE3P2410000613 - Time Range: "Last 6 hours" with refresh options
- Export/Share: Dashboard sharing and export functionality
Key Monitoring Metrics:
ATT (Attention/Alert) Section
Displays critical system status and alerts for the selected vehicle.
Device Information Panels
- OEM Device ID
- Status: "No data" (indicating potential connectivity issue)
- Purpose: Tracks original equipment manufacturer device identifier
- RAYG Device ID
- Status: "No data"
- Purpose: Monitors RAYG system device identification
- Firmware Version
- Status: "No data"
- Purpose: Tracks current firmware version for maintenance planning
- Fleet ID
- Value: "0"
- Purpose: Identifies which fleet the vehicle belongs to
Data Status Indicators:
- Blue panels with "No data": Indicates either no recent data transmission or connectivity issues
- Numeric values: Show current readings or counts
- Color coding: Provides quick visual status assessment
Device Monitoring Features
Real-time Data Tracking
- Live Updates: Dashboards refresh automatically based on configured intervals
- Historical Data: Access to historical performance and usage data
- Alert Integration: Immediate notifications for critical issues
Fleet Management Capabilities
- Multi-vehicle Monitoring: Track entire fleet from single interface
- Individual Vehicle Drill-down: Detailed analysis of specific vehicles
- Comparative Analytics: Compare performance across fleet
Data Sources
- OEM Integration: Direct connection to manufacturer systems
- RAYG System: Custom tracking and monitoring solutions
- Firmware Monitoring: Automatic version tracking and update notifications
Troubleshooting
Common Issues and Solutions
"No Data" Status
Symptoms: Panels showing "No data" instead of metrics Possible Causes:
- Network connectivity issues
- Device offline or not transmitting
- Configuration problems with data sources
- Time range settings too narrow
Solutions:
- Check device connectivity and power status
- Verify data source configurations
- Expand time range to include periods with known data
- Contact system administrator for backend issues
Authentication Problems
Symptoms: Unable to login or frequent logouts Solutions:
- Verify credentials with Omnivoltaic system
- Clear browser cache and cookies
- Check network connectivity
- Reset password if necessary
Dashboard Loading Issues
Symptoms: Dashboards not loading or displaying incorrectly Solutions:
- Refresh the browser page
- Check internet connection stability
- Try accessing from different browser or device
- Contact support if issues persist
Best Practices
Dashboard Usage
- Regular Monitoring: Check dashboards daily for fleet status updates
- Time Range Optimization: Use appropriate time ranges for your analysis needs
- Bookmark Frequently Used: Star important dashboards for quick access
- Share Insights: Use export/share features for team collaboration
Data Management
- Consistent Monitoring: Establish regular monitoring schedules
- Alert Configuration: Set up appropriate alerts for critical metrics
- Documentation: Keep records of significant events or changes
- Regular Reviews: Conduct periodic reviews of dashboard effectiveness
Support and Resources
Getting Help
- Omnivoltaic Support: For authentication and integration issues
- Documentation: Reference official Grafana documentation for advanced features
Training Resources
- User Guides: Additional documentation for specific features
- Video Tutorials: Step-by-step guidance for common tasks
- Best Practices: Recommended approaches for fleet management